The tension between growth concerns and corporate outlooks, between softening economic data and solid earnings reports, continued last week. Where prior weeks had seen the markets taking on a more risk averse tone, last week saw trading tilt more toward risk appetite. Let's break down the numbers.
Perspective
Stocks: All of the major U.S. equity indexes were in the black last week as the market saw impressive gains following five weeks of consolidation. There was a small cap and growth tilt in the trading action, with the Russell 2000 pacing the major indexes with a gain of more than 2.6%, followed by the NASDAQ Composite with a gain of 2.3%. The mega cap Dow Industrials brought up the rear with a still solid gain of more than 1.5% on the week.
Among the nine major S&P sectors, energy finished well out in front on the strength of advances in oil and gas prices, gaining better than 4% on the week. The only sector to finish in the red was the defensive consumer staples, posting a fractional loss. Though it is seldom mentioned in this series of articles, we also note that the Dow Jones U.S. REIT index reached a multi-year high last week.
In contrast to the strong performance turned in by U.S. equities, global markets had a much softer tone. Seven of the twelve major international indexes we monitor posted losses, and couple of the gainers were only barely in positive territory. The weakness was generally seen in Asia and in larger developing markets. Europe was a notable area of strength, despite the credit downgrade of Spain, political uncertainty in France, and all of the attendant worries.
Bonds: Yield generally fell across bond sectors and maturities as weaker global growth and a continuation of FOMC policy gave bond investors no reason to worry. This came despite a broad uptick in commodity prices. The benchmark 10 year Treasury note is back under 2%, signaling very low growth and inflation expectations. The Dow Jones Corporate Bond Index - a price, not yield index - is back above its 50 day SMA, indicating robust demand for corporate paper.
This demand is also seen in trading action in popular high yield ETFs such as HYG and JNK, which are back to February highs. Also back over the 50 day are municipal bonds, which corrected sharply from late February to the middle of March, but have been recovering nicely over the last six weeks.
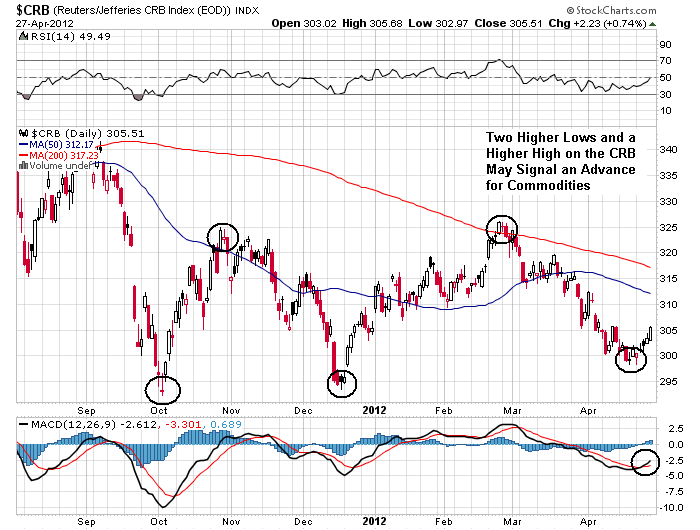
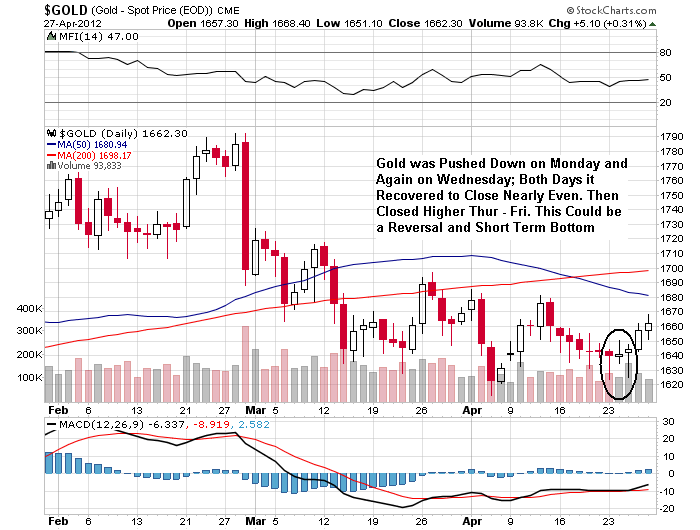
Commodities: One of the more consistent views in this series of articles is that the CRB index appears to find support around the 300 level. After a nine week slide on the broad index, we have seen this level come into play once again, as there has been a rally across many of the commodity groups. We saw a reversal day on the CRB Monday, and higher closes in all five trading sessions, capped by the strongest move on Friday, which closed near the high for the day. The S&P GSCI agriculture and industrial metals indexes posted gains in the 2%+ range, copper in particular having a strong with a 4% gain. The precious metals were off at the start of the week but appear to have put in a reversal day Wednesday.
Currencies: The U.S. dollar index was off over the course of the week, breaking below the 50 day SMA and closing under 79. The euro, still positively correlated with risk assets, is back above its 50 day and the key level of $1.32, even with the S&P downgrade of Spain. A classic case of selling the news, we might suppose, as euro shorts took profits. Beneficiaries of dollar weakness were seen far and wide - even in Britain, where news of official return to recession did not stop the Pound Sterling from making a strong move above $1.62. Canada's dollar rose above parity against the greenback, reaching its highest close since September.
Outlook
The week's economic news gave investors a number of items to consider. Perhaps most important was Q1 U.S. GDP that fell short of consensus expectation. The 2.2% number was certainly not disastrous, but neither was it the picture of robust growth. Coupled with the contraction in U.K. GDP which, as noted above, returned that economy to recession status, it cast a cloud on hopes for global recovery.
Also causing concern was the surprising contraction in March durable goods orders, which was negative even after eliminating transportation items. Unemployment claims added to the rainy day feeling by once again coming in higher than expected. Among the few bright spots were new home sales, which beat forecast. Not particularly newsworthy was the FOMC statement, which gave no indication of any change in policy direction, however there was a note of concern about stubbornly high energy prices.
Stocks: With last week's advance, we now find the Dow back above 13,000, the SPX above 1,400, and the NASDAQ above 3,000. All of them, and the Russell 2000 as well, are back above their 50 day SMAs. While I have been consistently bullish since early October, and was looking for another leg up after the consolidation of the past couple of weeks, the violation of the trend line and 50 day on the SPX led me to turn cautious. We stopped adding to long positions, as well as closing out one that wasn't performing.
Last week's action is encouraging. Earnings appear to be trumping growth worries, and with good reason. With more than half of the S&P 500 reporting on Q1 so far, over 70% have beaten estimates. Our favorite sector, tech, has put up particularly strong numbers. Even so, we probably aren't out of the woods until the indexes top February levels, so I believe some level of caution is still warranted.
(click to enlarge)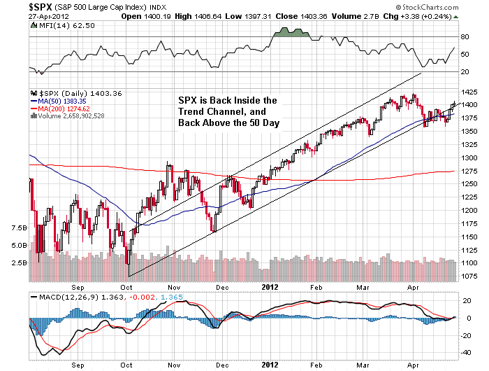

Another positive is the improving market breadth. Regular readers know that I look at the McClellan Oscillator and the longer term Summation Index, which are based on advance-decline data, as indicators market breadth and overall health. Notes on the Summation Index chart below suggest the next leg up I have been anticipating may be under way. Either way we will see. New long trading positions here are a bit more speculative, positions established at new highs on the indexes may be more conservative.
(click to enlarge)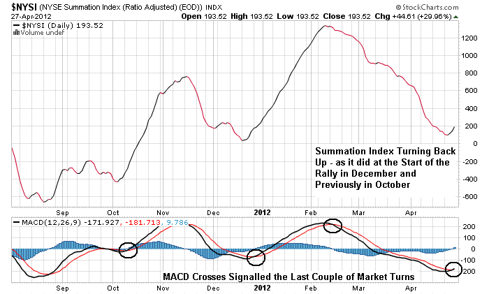

Bonds: Where the stock market appears to be reacting to corporate earnings, the bond market appears to be reacting to economic data. Both of those positions make sense, but present a bit of a muddle when taken together. Growing corporate earnings tend to signal economic expansion, but falling bond yields tend to signal a lower growth outlook. Of course some analysts will say that the Fed is distorting the bond market, but I am skeptical. The Treasury market alone is too large, never mind the entire bond market, for the Fed to have that kind of effect. My thinking here is that the bond market is looking at the GDP and other economic data and seeing little prospect for growth and therefore for inflation.
With the political focus on debt reduction this just may be right; we have recently seen recession as a result of austerity policies in Britain, where the Cameron government has been somewhat of a pioneer in this area. If the bond market is seeing austerity policies and deleveraging everywhere it looks, it may be eminently sensible to forecast low or even negative growth, and bid up paper at current rates in anticipation of even lower rates to come. This is not an encouraging outlook, but we'll have to watch what the markets do.
Commodities: Turning commodities, we're back to the growth side of the outlook. As mentioned above, the CRB index again found support under 300, and a range of commodities are participating in the nascent advance. Spot oil has been flirting with $105 and the 50 day SMA, while natural gas popped back above $2. While it's difficult to be bullish on gas, oil is hanging in very stubbornly and in the face of political threats to trading limits, etc.
A long trade in a broad commodity ETF could make sense here. Gold, as previously stated, saw some interesting trading last week. We have been in a slightly underwater trading position for the last couple of months and were on the verge of being shaken out several times but have stayed with it. What I saw last week is noted on the chart below. We'll see what happens.
(click to enlarge)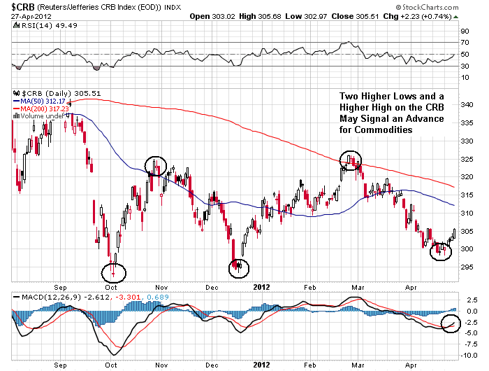
(click to enlarge)
Currencies: It should come as no surprise that recent weakness in the U.S. dollar has coincided with the advances in equities and in commodities. This series of articles has consistently followed the formula dollar/euro = risk off/risk on. While that may be something of an oversimplification, in broad outline the correlation has held. As I have reminded readers so often, this has not always been the case, and is not likely to be the case forever, but for now it holds and is a pretty reliable signal as to which way risk assets might go. The trend here really is helpful, so we continue to watch it.
(click to enlarge)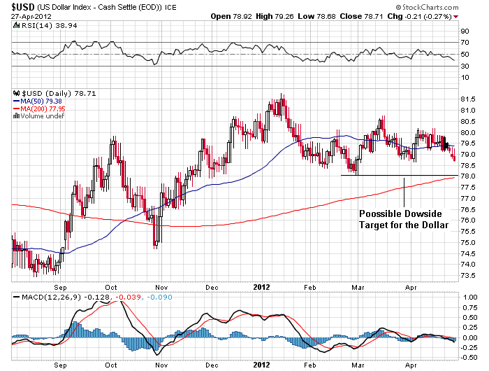

The dollar has broken the 50 day. For the coming days and weeks, it looks like it is headed back toward a test of the February lows and the 200 day, around 78 on the dollar index. This is a positive signal for equities and commodities based on the correlation we have been following.


0 comments:
Post a Comment