U.S. dollar jumps on Aussie after RBA rate cut

23:58 |


HONG KONG (MarketWatch) — The U.S. dollar weakened a bit against major currencies Tuesday after an improvement Chinese manufacturing data in April, although it rallied against the Australian currency after an aggressive interest rate cut by the central bank there.
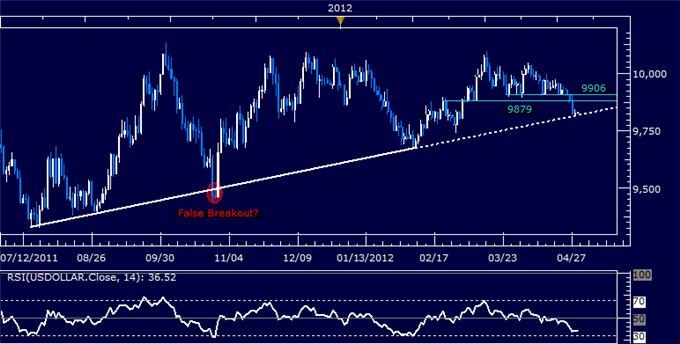
The ICE dollar index DXY -0.07% , which measures the greenback’s performance against a basket of six major global currencies, slipped to 78.728 from 78.779 in North American trade late Monday.
The mild weakness came after an official survey of Chinese manufacturing activity showed a continued improvement for a fifth straight month in April, signaling stabilized economic conditions. Read full story on China economic data.

Dow ends higher for 7th straight month

The Dow traded lower after Spain officially entered a recession and domestic readings on the economy and personal spending deteriorated.
Among major currencies, the euroEURUSD +0.11%  was trading at $1.3245, little changed from $1.3242. The British pound GBPUSD -0.10%  was fetching $1.6225 compared with $1.6233.
The dollar USDJPY -0.10% , meanwhile, was changing hands for 79.73 yen, slipping from ¥79.82 as Japanese stocks dropped sharply in Tokyo. Read more on Asia markets
However, the Australian dollarAUDUSD -1.04%  skidded against the greenback and was changing hands at $1.0319, losing more than a U.S. cent from the day’s high.
The drop came after the Reserve Bank of Australia cut its policy interest rate by 50 basis points to 3.75%, against expectations for a 25 basis point reduction, citing moderating inflation and weaker-than-expected economic data.
Read More

EUR/JPY - Elliot Wave Count Suggests It May Be Time To Take The Money & Run

23:41 |


EUR/JPY - Elliot Wave Count Suggests It May Be Time To Take The Money & Run

Last week I felt 'it could be wise to further protect our position by lowering our stop from 109.90(Update 1) to around 108.20 (locking in roughly 200 pips) , with the Fed and BoJ interest rate decisions due out later in the week'. Sure enough, the Fed decision saw little changed from their March statement and the BoJ underwhelmed yet again (surprise, surprise). After a brief spike in many of the JPY-crosses after the BoJ announcement, EUR/JPY quickly traded back off (within hours) to make fresh lows on the week. Today we witnessed further JPY appreciation as USD/JPY fell below the key 80.10 level highlighted in Thursday's TECH TALK, consequently EUR/JPY too traded lower, taking out the 38.2% retracement around 105.95/00 in the process.
With that said, although the pair has broken lower my primary Elliot Wave count suggests EUR/JPY is in wave-b (grey) of wave-B (black), which implies another correction back higher could be in order (under NO circumstances does this mean I'm turning bullish, just perhaps less bearish) - However, in the immediate short-term while it remains below 106.30 (last Monday/Tuesday lows) an alternative count still remains valid, looking for one final push lower (below the April 16th low) which would likely see a test of the 104.25/35 area - Convergence of the 50% retracement, 100-day sma and bottom of the daily Ichimoku Cloud. Let's also keep in mind that we have plenty of top-tier data out of the EU later in the week (predominately employment and PMI figures as well as the ECB interest rate announcement) which could positively or negatively influence the Euro.
Accordingly, I believe it is prudent to move our stop lower to around 106.40/45*, which is just above the lows cited above, and locks in about 380 pips . Furthermore, I also think it could be wise to raise our second limit from the 102.25/50 area higher to around the 104.25/35* convergence zone as it appears likely to hold on an initial attempt.
Read More

Nikkei drops 1.8 percent

23:25 |

TOKYO (Reuters) - Japan's Nikkei share average shed 1.8 percent to hit a 2-1/2 month closing low on Tuesday, hurt by uncertainty on the euro zone and concerns over U.S. economic growth, while a strong yen weighed on exporters.
                              
                                             Cherry blossoms are seen in front of the Tokyo Stock Exchange building in Tokyo April 11, 2012. REUTERS/Toru Hanai
The Nikkei (NIK:^9452) closed down 169.94 points at 9,350.95, breaking below its 75-day moving average near 9,463, after losing 5.6 percent in April to end a four-month winning streak.
The broader Topix fell 1.8 percent to 789.49, breaking below 800 for the first time since mid-February.

Read More

Natural Gas: Beaten Down, but Looking Up

23:10 |


Natural gas has been pushed further and further down for the past few years. According to Business Insider, Professor Mark Perry of the Carpe Diem blog noted that if adjusted for inflation, natural gas prices have reached a multidecade low.
Reasons for the continuous price decrease include a warmer winter (heating costs were reduced) and increased supplies from easy drilling. Due to higher oil prices and environmental concerns, though, more and more people are beginning to use natural gas for a multitude of purposes. With the interest in using natural gas piquing, some companies have to benefit from it.
Kapitall reported some points from Croft Leominster, a value mutual fund with a contrarian perspective. According to Croft, because gas trades below the industry's marginal cost of production, we'll see companies shutting down and going back into oil, which will slow supply and drive up the price of natural gas. And, he argues, since natural gas is already seeing increased demand, the shift in production will further stress the supply/demand issues that are good for prices in the middle to long term.
Business section: Investing ideas
The natural gas bandwagon is beginning to look inviting, and there are companies that stand to profit from a swing toward its use. Below is a list of companies that are heavily exposed to natural gas. Do you think these names will see an upside from the trend?
List sorted by market cap. (Click here to access free, interactive tools to analyze these ideas.)
1. Williams (NYSE: WMB  ) : Engages in finding, producing, gathering, processing, and transporting natural gas primarily in the United States. The company has a market cap of $20.04 billion, most recent closing price at $33.89.
2. Spectra Energy (NYSE: SE  ) : Engages in the ownership and operation of a portfolio of complementary natural gas-related energy assets in the United States and Canada. The company has a market cap of $19.9 billion, most recent closing price at $30.49.
3. ONEOK (NYSE: OKE  ) : Operates as a natural gas distributor primarily in the United States. The company has a market cap of $8.88 billion, most recent closing price at $84.96.
4. Sunoco (NYSE: SUN  ) : Through its subsidiaries, refines and markets petroleum products, and manufactures chemicals in the United States. The company has a market cap of $4.37 billion, most recent closing price at $40.63.
5. Targa Resources: Through its general and limited partner interests in Targa Resources Partners, provides midstream natural gas and natural gas liquid services in the United States. The company has a market cap of $2.02 billion, most recent closing price at $47.51.
6. Crosstex Energy (Nasdaq: XTXI  ) : Through its partnership interest in Crosstex Energy, L.P., engages in gathering, transmission, processing, and marketing natural gas and natural gas liquids in the United States. The company has a market cap of $707.99 million, most recent closing price at $14.87.
Interactive Chart: Press Play to compare changes in analyst ratings over the last two years for the stocks mentioned above. Analyst ratings sourced from Zacks Investment Research.
Read More

METALS-Copper hovers near $8,400, China data supports

22:41 |


Mon Apr 30, 2012 11:34pm EDT
* China PMI hits 13-month high in April
    * Thin trading with many Asian markets closed
    * Coming Up: U.S. ISM Manufacturing PMI; 1400 GMT

 (Adds China data, comments, updates prices) 
    By Manolo Serapio Jr 
    SINGAPORE, May 1 (Reuters) - Copper steadied near $8,400 a
tonne on Tuesday as brisk manufacturing data in top consumer
China helped counter concerns about a recession in Spain and a
fragile U.S. economy.  
    Trading was thin with most Asian markets shut for the May
Day holiday, including China, limiting the market impact of data
showing a sustained expansion in China's factory sector. 
    China's official purchasing managers' index rose to 53.3 in
April from 53.1 in March, signalling the world's No. 2 economy
may be quietly recovering from a first-quarter trough.
  
    "It's a positive read and should ease some of the market
jitters coming from the euro zone of late," said Natalie
Robertson, analyst at Australia and New Zealand Bank. 
    "The tight supply situation has been holding up prices quite
strongly and all we need is to see a pickup in demand and prices
will continue to rally." 
    Three-month copper on the London Metal Exchange 
slipped $20 to $8,380 a tonne by 0314 GMT, after hitting a
session high of $8,420. Volume traded on LME Select was a paltry
663 lots.     
    Tight global supply has helped copper gain 10 percent so far
this year given delays in additional capacity coming through to
market.  
    Global demand for refined copper is expected to exceed
production by 240,000 tonnes in 2012, before it reverses a
three-year trend of market deficits with a production surplus in
2013, according to the International Copper Study Group on
Monday.  
     
    CHALLENGING CONDITIONS 
    Copper rose to its highest in nearly a month on Monday,
hitting $8,496.75, as LME stockpiles MCU-STOCKS fell to the
lowest since October 2008, at 241,550 tonnes. 
    Because of tighter LME supplies, which have sharply pushed
up premiums of spot prices over those for later deliveries,
large Chinese copper smelters said they will sell refined copper
to LME warehouses over the next two months.  
    The premium for LME cash copper against three-month delivery
material MCU0-3 soared to $149 per tonne on Friday, the
highest since August 2008. 
    The supply deficit should help copper prices, which have
fallen more than 4 percent from the 2012 peak of $8,765, recover
in the second half, said Credit Suisse. 
    "For the very near term, it will be important for the market
to defend the $7,900/$8,000 support in order to prevent another
bout of weakness," Credit Suisse said in a note. 
    The challenging economic conditions are taming some copper
bulls. While China's economy is showing some signs of perking up
this quarter, the U.S. economy appeared to downshift, with
consumers increasing their spending only modestly last month and
a gauge of business activity in the Midwest falling sharply in
April.  
    There was more bad news out of Europe on Monday after Spain
sank into recession in the first quarter and economists say
spending cuts and a reeling bank sector would delay any return
to growth until late this year or beyond.  
         
  Base metals prices at 0314 GMT
  Metal              Last       Change   Pct Move YTD pct chg
  LME Cu            8380.00    -20.00     -0.24     10.26
  HG COPPER MAY2     381.90     -1.45     -0.38     11.15
  LME Alum          2115.00     -4.00     -0.19      4.70
  LME Zinc          2049.25    -12.75     -0.62     11.07
  LME Nickel       17900.00      5.00     +0.03     -4.33
  LME Lead          2145.00     -3.00     -0.14      5.41
  LME Tin          22720.00    -55.00     -0.24     18.33

Read More

UPDATE 1-Brent-WTI crude spread may widen sharply end-2012 - JPMorgan

22:36 |


Tue May 1, 2012 12:31am EDT
May 1 (Reuters) - The spread between Brent and U.S. crude futures could widen sharply at the end of the year, depressing U.S. oil prices, as refinery maintenance reduces crude demand, J.P. Morgan Chase said late on Monday.
"We expect the spread to be very volatile, pushing above $15 a barrel at the end of the year as the three-month-long maintenance at the BP Whiting refinery kicks in just ahead of the expansion of the Seaway pipeline," J.P. Morgan analysts led by Lawrence Eagles said in a weekly oil report dated April 30.
"We also anticipate a further brief widening of the Brent-WTI spread at the end of the first quarter in 2013 when seasonal maintenance in the PADD 2 region will likely temporarily increase the regional surplus."
The bank also revised down its 2012 forecast for West Texas Intermediate (WTI) crude prices by $3 to $108 a barrel although it kept forecasts for Brent unchanged on Asian demand and stable supply dynamics.
On Tuesday, Brent's premium to WTI was at $14.55 a barrel after settling at $14.60 on Monday.
A reversal in oil flow at the Seaway pipeline from mid-May could first narrow the Brent-WTI spread to $6 per barrel or less, J.P. Morgan said.
The project is aimed at easing high crude oil stocks at Cushing, Oklahoma, the delivery point for WTI contracts, and also the downward pressure on prices.
Crude stocks reached record levels in Cushing last year, pushing the Brent-WTI spread to its widest at nearly $28, due to a lack of pipeline capacity to divert the excess supply and as production from U.S. and Canada oil shales rose.
Read More

Australian Dollar Drops on Unexpectedly Large RBA Rate Cut

22:19 |


The Australian Dollar fell as traders were forced adjust their positions after the RBA cut its key interest rate in the face of a global slowdown of demand for Aussie goods. 
THE TAKEAWAYReserve Bank of Australia Unexpectedly Cut Cash Rate to 3.75%, Policy Statement Dovish > Fears of Global Growth Slowdown Return, Leading Traders to Adjust Portfolios > AUDUSD Drops on Catch Up in Sell Off of Other Risky Assets
Read More

Gold Short Term Bullish Base?

22:00 |

eliottWaves_gold_body_gold.png, Gold Short Term Bullish Base?
Prepared by Jamie Saettele, CMT
Last week’s hold above the 4/4 low suggests that gold has been forming a bullish base since mid-March. Exceeding the April high would put bulls in control towards the trendline above 1700 (that line extends off of the September 2011 and February 2012 highs).
Read More

EURUSD Inches Towards Trendline

21:59 |

eliottWaves_eur-usd_body_eurusd.png, EURUSD Inches Towards Trendline

For most, trading in the middle of this range is not ideal. Price is currently pressing againstresistance from former trendline support and congestion from late March / early April. Trendline resistance is just below 13300 as well. Hopefully, early May can provide a pivot to trade to from. Recent lows at 13155 and 13100 are near term supports. I don’t want to strongly suggest a direction when the market is drifting sideways but the inability of the EURUSD to break 13000 after 3 attempts in the last 2 months hints that the break will be higher. EUR event risk is heavy Wednesday through Friday.
Read More

FOREX-Yen keeps climbing as data saps risk appetite

21:57 |


Mon Apr 30, 2012 7:10pm EDT
* Disappointing data weighs on risk appetite
* Markets now eyeing China PMI
* Aussie braced for 25 bps RBA rate cut, 50 bps a danger
* Many Asian centers shut for holiday
By Ian Chua
SYDNEY, May 1 (Reuters) - The yen held at two-month highs against the dollar on Tuesday, having rallied across the board overnight as investors snapped up the safe-haven currency after disappointing economic news from Canada to Spain tempered risk sentiment.
Data showing Spain slipping into recession, Canada's economy unexpectedly shrinking in February and business activity in the U.S. Midwest falling sharply gave markets the green light to cash in on recent gains in risk assets.
The dollar fell as deep as 79.73 yen, bringing the 100-day moving average at 79.58 in focus. It last stood at 79.85. The euro skidded to a two-week low at 105.47 yen , before steadying at 105.74.
Traders said final month-end positioning on Monday also contributed to the choppy price action.
The market is now bracing for the official reading of China's manufacturing activity due at 0100 GMT. Forecasts is for the PMI to come in at 53.6, versus 53.1 in March, so a weaker reading could spark further risk aversion.
Still, trading is likely to be subdued with much of Asia and Europe shut on Tuesday for the May Day holiday.
The Canadian dollar was among the biggest losers after the economy shrank by 0.2 percent in February, cooling talk that the Bank of Canada could start raising interest rates in the near future.
It slid below 81.00 yen for the first time since April 17, while the greenback rose to C$0.9874, pulling up from a 7-1/2 month low around C$0.9800 plumbed Friday.
"We buy CAD/JPY at the 80 handle or possibly a bit below, given likely heavy stop losses/take profits around that area," said Sebastien Galy, strategist at Societe Generale.
Also losing a bit of ground, the Australian dollar slipped to $1.0420, from a one-month peak of $1.0475 set on Friday.
The Aussie's immediate fortunes depend on what action the Reserve Bank of Australia (RBA) takes at the end of its policy meeting at 0430 GMT. An easing is considered a done deal with only the size in doubt.
Markets are giving a one-in-four chance of a deep 50 basis point cut to the 4.25 percent cash rate. This means anything less than that could see the Aussie stage a bit of a bounce.
"If only 25bp is delivered, it will be up to the tone of the accompanying RBA statement to prevent the AUD from rallying on the decision," analysts at BNP Paribas wrote in a client note.
Indeed, any hint of a follow-up cut in June should limit a strong positive response in the currency.
Read More

Nikkei opens down as yen pressures exporters

21:53 |


Mon Apr 30, 2012 8:09pm EDT
TOKYO, May 1 (Reuters) - Japan's benchmark Nikkei average
 opened down 0.5 percent at 9,471.66 on Tuesday, with
exporters pressured by a stronger yen after U.S. markets
weakened and Spain said it had slipped into recession. 
    The broader Topix shed 0.3 percent to 801.76.
Read More

Australian Dollar Sold as Chinese PMI Data Disappoints

21:51 |


The Australian Dollar fell after poor manufacturing-sector Chinese PMI data, compounding expectations of an RBA cash rate cut later this morning. 
THE TAKEAWAY: Chinese Manufacturing PMI Rose to 53.3 in April > Fears of Global Growth Slowdown Renewed, Leading Traders to Adjust Portfolios >AUDUSD Fell
Read More

US Dollar Holds Key Trend Line Support as S&P 500 Pulls Back

21:46 |


The US Dollar managed to hold above trend-defining rising trend line support set from August 2011 as the S&P 500 pulled back to digest recent gains. 
THE TAKEAWAYThe US Dollar managed to hold above trend-defining rising trend line support set from August 2011 as the S&P 500 pulled back to digest recent gains.
S&P 500 – Unchanged from yesterday: “Prices took out resistance at 1399.10, the 61.8% Fibonacci retracement level. The bulls now target the 76.4% level at 1409.00. The 1399.10 level has been recast as near-term support.”
US_Dollar_Holds_Key_Trend_Line_Support_as_SP_500_Pulls_Back_body_Picture_5.png, US Dollar Holds Key Trend Line Support as S&P 500 Pulls Back
Daily Chart - Created Using FXCM Marketscope 2.0
CRUDE OIL – Prices put in a Hanging Man candlestick below resistance at 104.90, a former support level, to hint that a pullback may be ahead. A turn lower from here sees initial support at 102.20. Alternatively, a breakout higher targets trend line resistance now at 105.91.
US_Dollar_Holds_Key_Trend_Line_Support_as_SP_500_Pulls_Back_body_Picture_6.png, US Dollar Holds Key Trend Line Support as S&P 500 Pulls Back
Daily Chart - Created Using FXCM Marketscope 2.0
GOLD – Prices took out the top of a falling channel set from early March, with the bulls now aiming to challenge resistance at 1680.00 and 1696.88 marked by key swing highs set on April 12 and March 27. The channel top, now at 1656.74, has been recast as near-term support.
US_Dollar_Holds_Key_Trend_Line_Support_as_SP_500_Pulls_Back_body_Picture_7.png, US Dollar Holds Key Trend Line Support as S&P 500 Pulls Back
Daily Chart - Created Using FXCM Marketscope 2.0
US DOLLAR – Unchanged from yesterday: “Prices are testing rising trend line set from late July 2011, with a break lower threatening to initiate a material bearish trend change. A confirmed break lower initially exposes 9772. Near-term resistance line up in the 9879-9906 area.”
US_Dollar_Holds_Key_Trend_Line_Support_as_SP_500_Pulls_Back_body_Picture_8.png, US Dollar Holds Key Trend Line Support as S&P 500 Pulls Back
Read More

May Day- A Day Dedicated To Workers

21:34 |


Labour Day also known as a day of workers. Labour Day is dedicated to workers and employers for their big contribution in economic and social areas. By the efforts of Labour Union Movement, an annual holiday is celebrated in all over the world. 

On the Labour Day many programs are organized to increase the education and social status of workers or labours. May 1st is the day of ‘May day’ in so many countries. ‘May day’ is called ‘Labour Day’ in India. And ‘Labour day’ is also called “International Workers Day’. 

India celebrated the first Labour Day on May 1, 1927. Many Labour Unions are participated in this celebration with pageants in ‘Mayday’ all over India. India also celebrated as ‘Spring Wealth Feast’ for the goddess ‘Spring’. ‘Labour day’ is an official holiday in many countries all around the world. The Triumph of Labour Statue” was made by Sculptor Debi Prasad Roy Chowdhry.   

The statue’ depicts an inspiring posture of a team of workers  engrossed at an difficult work. This  statue was the first statue erected in Marina Beach. On 25th January 1959, the  statue of “Triumph of Labour”  made by  the Sculptor Mr.Devi Prasad Roy Chowdri was declared open by the then Honble Governor of Tamil Nadu Shri.Bishnuram Medhi in the presence of Mr.Kamarajar, the Honble Chief Minister of Tamil Nadu.
Read More