I am having a great debate on Seeking Alpha with Paulo Santos on the market fundamentals of the U.S. coal and natural gas sectors. Our debate interested a lot of SA readers as reflected in the comments.
My last article analyzed the yearly and monthly EIA data to show that natural gas has not taken away demand of coal in the U.S. electricity power industry. Paulo believed that more recent data may show a massive coal to gas switch due to record low natural gas prices, as he saw remarkable year-over-year percentage increase in the EIA weekly natural gas updates. I decide to scrutinize the weekly data for a definite answer. I will discuss what I find in the EIA weely updates.
As I have discussed, up till the end of 2011, there were plenty of signs of a long-term trend of expanded natural gas usage in the electric power sector. But there was no indication natural gas is displacing any coal demand. But people wanted to see more recent data to see if there are new developments. EIA releases weekly natural gas updates which may provide a glimpse to the latest data on natural gas supply/demand, for those eager to see the latest data.
Unfortunately, unlike in the monthly releases where the supply demand numbers are provided in explicit unit of BCF (billion cubic feet), no actual volume of natural gas supply is given in the weekly data. Only percentage changes are given: Changes from the week a year ago; and changes from a week ago.
It is possible to deduce actual numbers in BCF, by tracking the week-over-week percentage changes, and fitting the data with appropriate starting points so the monthly tallies are consistent with the numbers contained in EIA's monthly releases. I did that, and come out with data that matches the EIA monthly data accurately. The bottom portion of the data table shows EIA months data, which run to January, 2012, on the left next to my projection numbers, which run to April, 2012.
Here is the spread sheet data table:
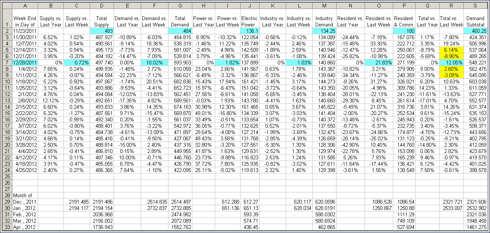
The idea of my data fitting is that we have the numbers of week by week percentage changes that are provided in the weekly update. If we select a proper number for the starting week, then all of the rest of weeks can be calculated. There is one problem, there was no data on the Christmas week ending 12/28/2011. Fortunately, EIA also provided monthly updates, which so far includes December 2011 and January 2012 data. So I can select reasonable starting numbers and assign reasonable percentage changes for the missing week. When the monthly tally is deduced from the weekly numbers, they should match the monthly supply (dry production plus imports and minus exports) & consumption numbers from EIA.
In the data table, the blue cells are my chosen fitting numbers. The monthly tallies are calculated from calculated weekly numbers and they are compared with EIA's monthly numbers at the bottom portion of the table. You can see they match perfectly.
I must point out that some of the year-over-year percentage changes for the total demand, marked yellow in the table, make no sense. See the screen snapshot of the 12/15/2011 update for an example:
(Click to enlarge)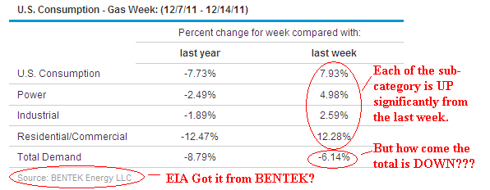

I marked those data as yellow and changed them to more reasonable values. Such modifications do not affect the plotted chart of supply and demand below. The chart is plotted using data from the columns D, G, J, M and P, representing supply, total consumption, electric power, industrial demand, residential/commercial:
(Click to enlarge)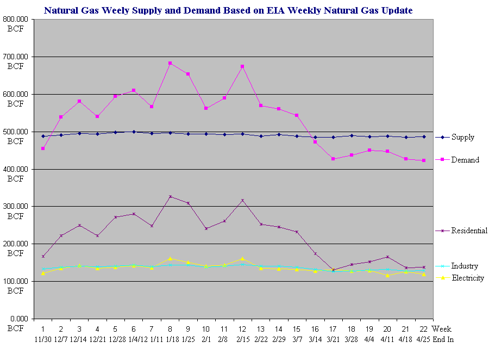
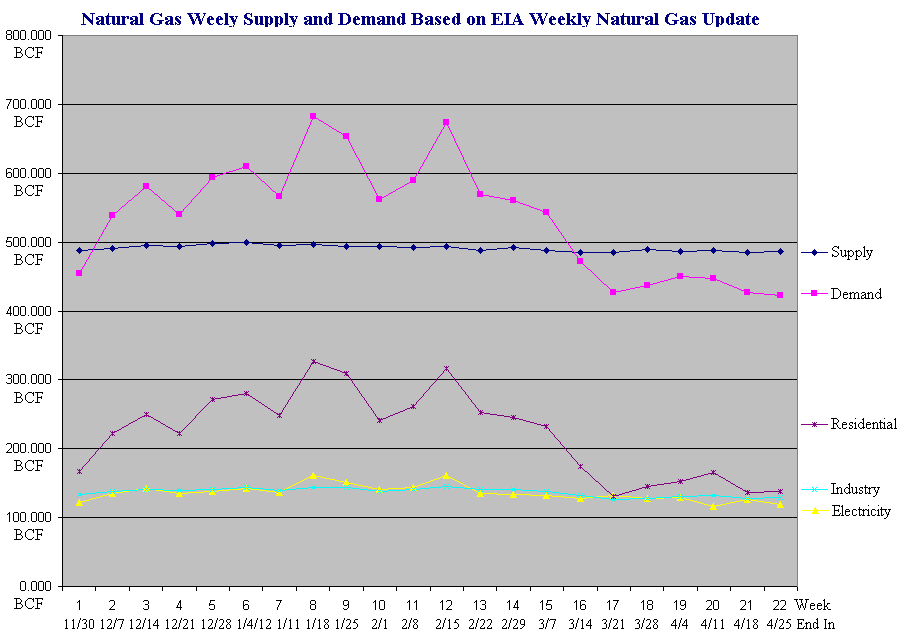
There are 22 weeks of supply and demand data in the above chart, from 11/30/2011 to 4/25/2012. What can we conclude from the chart?
- The supply is flat and gradually trending down. This is an early sign that natural gas producers are trying to cut production.
- Residential and commercial demand is by far the largest natural gas demand. It was hit hard by a warm winter. The demand was not high enough to sufficiently draw down the storage level.
- The much talked about natural gas demand in the electricity power sector is nothing spectacular. It was only slightly up a few weeks but generally flat, and is trending down slightly as the winter has ended.
- There is still no sign of the surge of natural gas demand in the electrical power sector, even though many people, like Paulo Santos, had been taking about the "massive" coal to gas switch.
The conclusion is: Other than the effect of seasonality, there is no evident boost of natural gas consumption in the electricity sector, thus the widespread myth that there is a massive switch from coal to natural gas, is debunked. There is NO such switch. Please refer to my instablog post where I keep updates with more data elaboration.
One particular note on the April 2012 power sector consumption of natural gas: My April data tallies up to 436.45 BCF (see table at J33) with 5 days missing. Extrapolating the 119.613 BCF (at cell J24) from the week ending April 25 for 5 days, the April 2012 figure comes up to 521.888 BCF, and is slightly lower than 525.956 BCF of April 2011. If my number is correct, it tells that the presumed coal to gas switch that Paulo Santos talked so much about, is now completely gone!
What's the implication of this conclusion? It's very good news for folks invested in coal mining stocks. We do not need to worry about natural gas taking demand away from coal. You will be disappointed if you have hoped for a natural gas price super surge.
I continue to believe that both natural and coal are poised for an imminent price surge. But the coal sector is much more profitable than the natural gas sector moving forward.
Last week, Encana Corp. (ECA) reported a thin profit. Although it is good news that the company hedged its natural gas production, I don't know how it can correctly amortize the cost of well drilling, since no one knows how long the wells will last and how much gas can be produced. I have an upcoming article on problems with shale gas. Stay tuned!
I continue to urge people to avoid ETFs like UNG and KOLD. They are good short-term gambles but not long-term investments. I advise people to be cautious and skeptical in natural gas companies like Chesapeake Energy Corp. (CHK), ConocoPhillips (COP), Anadarko Petroleum Corp. (APC), EOG Resources Inc (EOG), Devon Energy Corp. (DVN), and Baker Hughes Inc. (BHI).
Instead you should pick up values in U.S. coal mining companies like James River Coal Co. (JRCC), Patriot Coal Corp. (PCX), Arch Coal Inc. (ACI), Alpha Natural Resources Inc. (ANR), Alliance Resource Partners (ARLP), Cliffs Natural Resources Inc. (CLF), Peabody Energy Corp. (BTU), and Walter Energy Inc. (WLT). They have been deeply discounted to ridiculous levels. As Peabody Energy's earnings results show, U.S. coal investors do not need to be pessimistic after al


0 comments:
Post a Comment