The 3rd quarter of 2012 is over and to my dismay we registered a gain in the Dow once again. We have now recorded gains in the Dow 11 out of the past 12 months - a feat so unusual it has not occurred since 1959.
We have managed to accomplish this unusual feat by applying the following logic:
- Monetary policy is rapidly depreciating the value of currencies worldwide, guaranteeing a rise in asset prices including stocks and commodities.
- Even with the global backdrop of high debt, deficit spending and high unemployment, U.S. stocks must go up as they represent the best of the worst.
- Money will naturally flow into U.S. stocks because there is no other logical place for money to go with bond yields artificially depressed by monetary policy.
Of late I have been referring to the impressive climb in stocks as the "Bernanke equity bubble of 2012." If stocks have climbed based on the perception that monetary policy is rapidly eroding the value of the dollar it is an erroneous perception. That might come as quite a shock to investors but it is true.
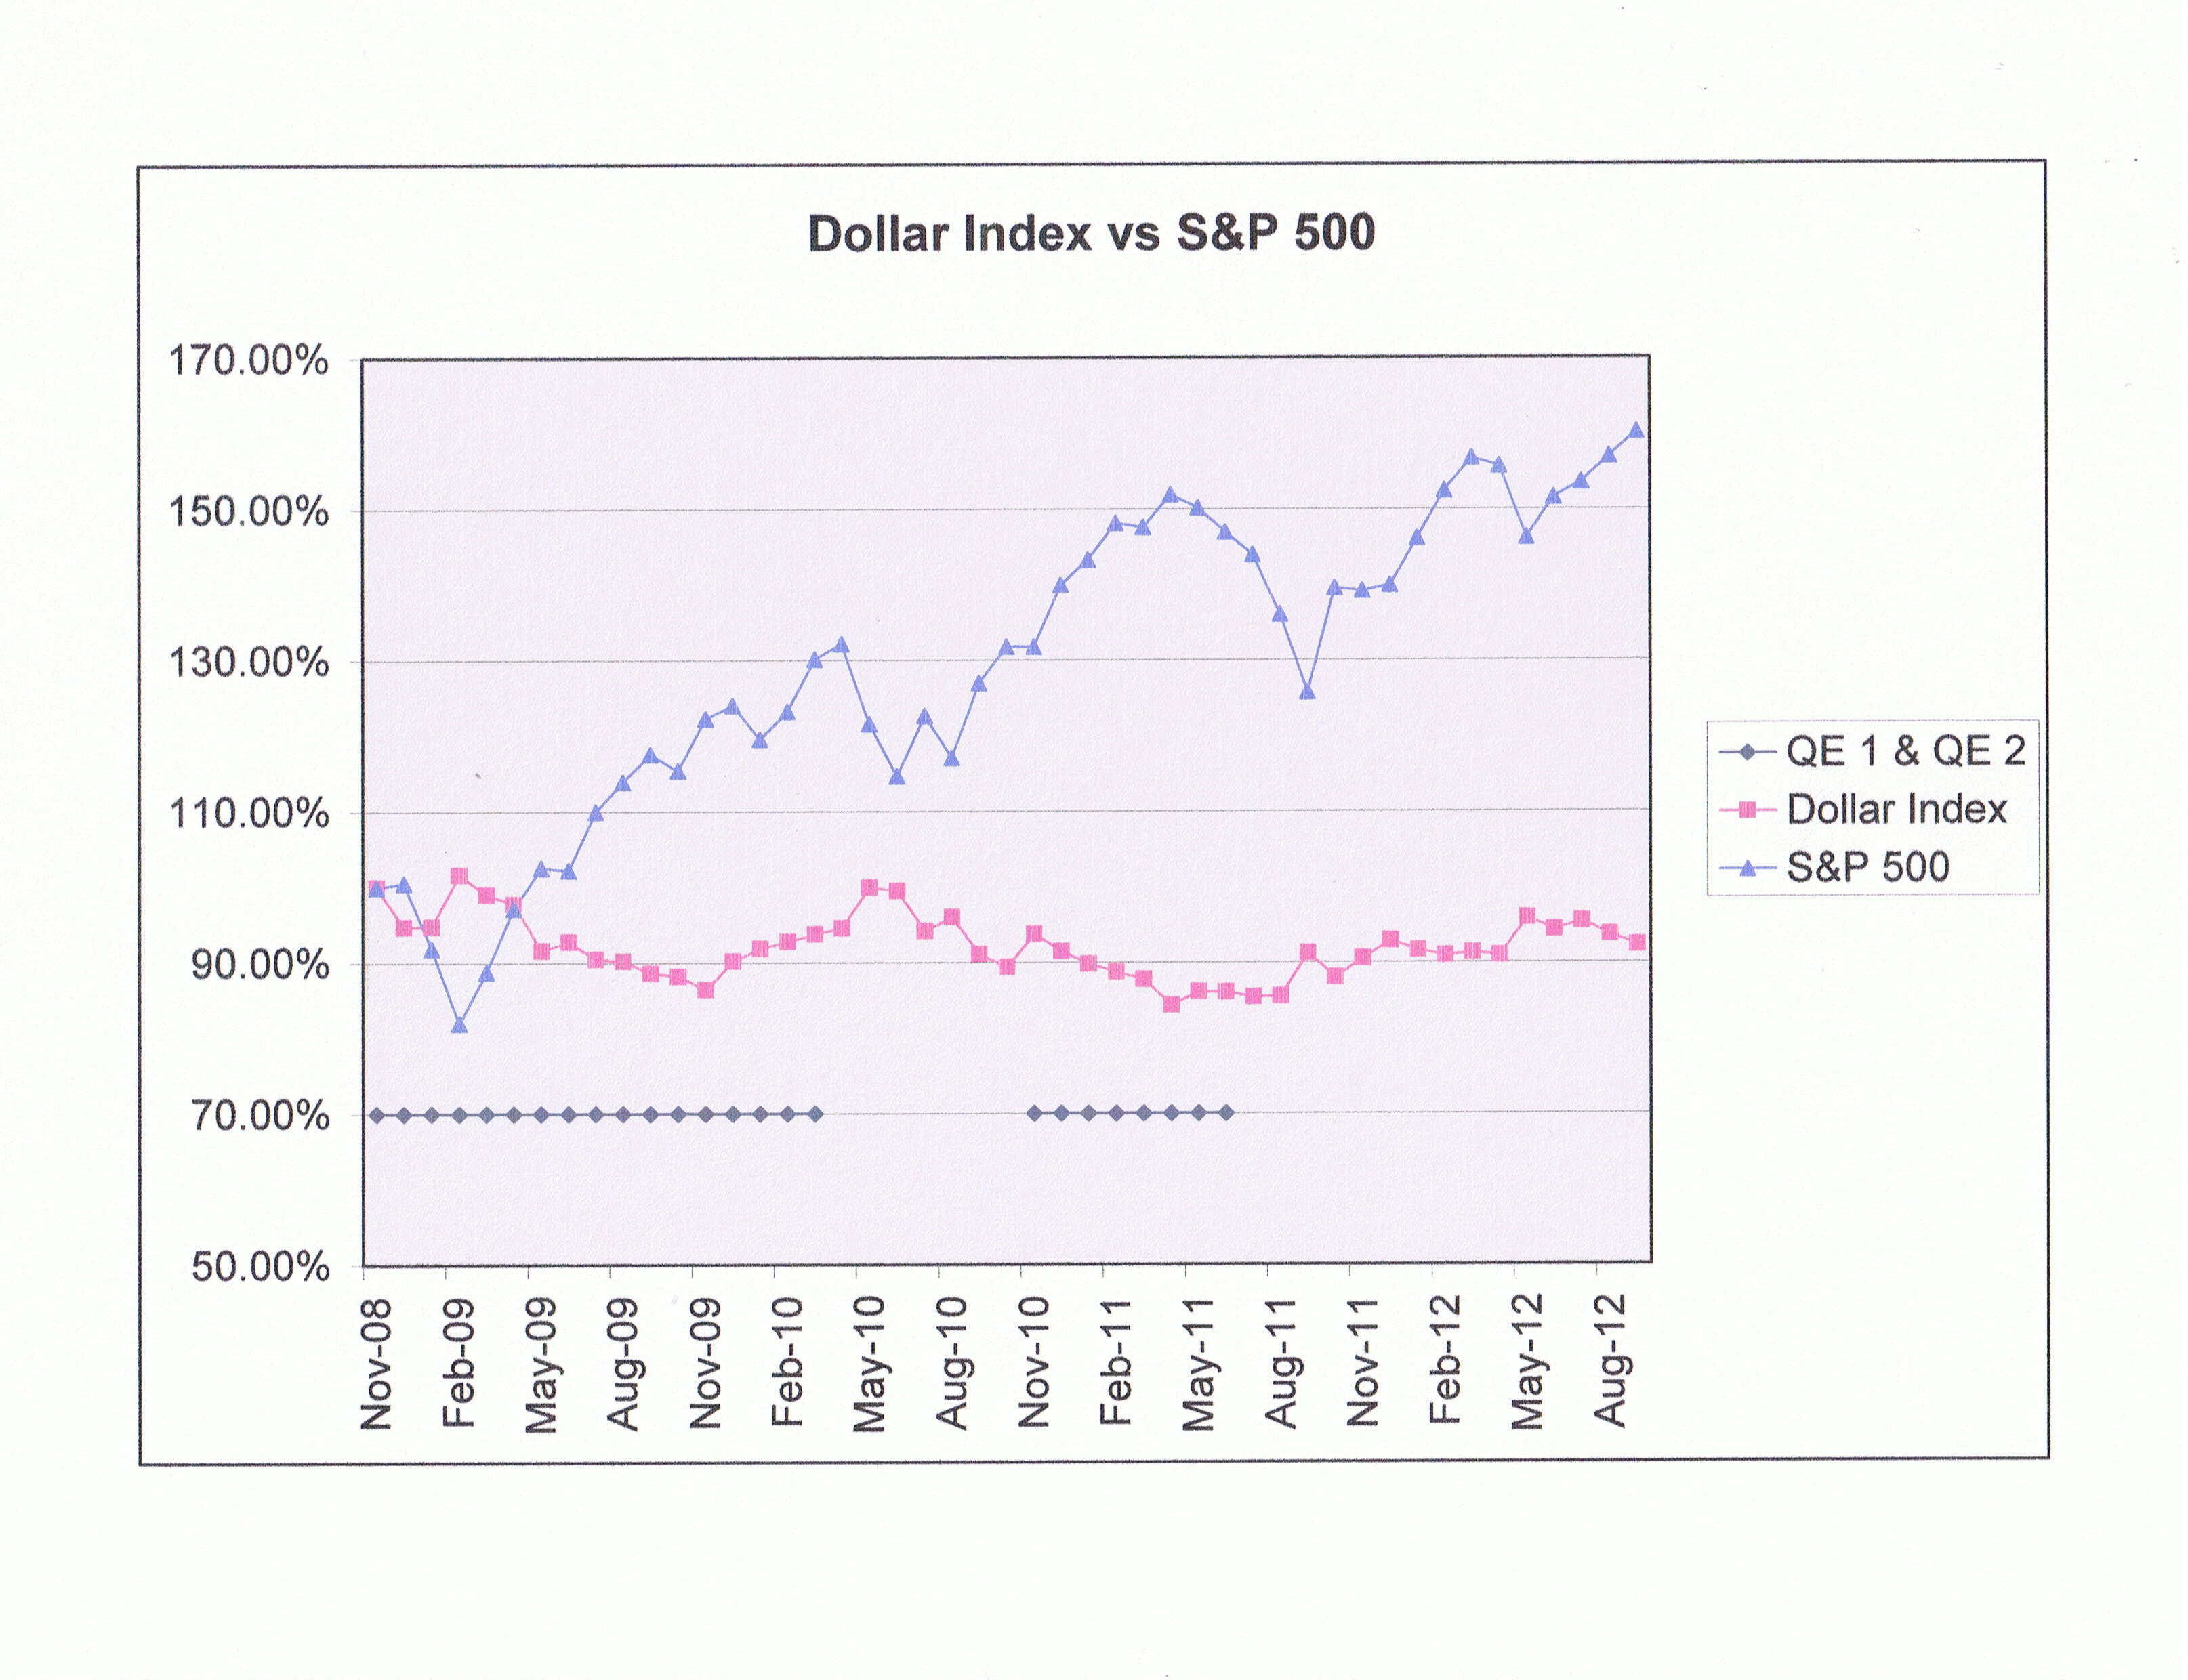
The Fed announced QE3 on September 13. The market had just one day of follow through on this much anticipated announcement of QE3 and has moved lower ever since. Since the September 14 low on the U.S. dollar index at 78.72, the dollar has climbed back to 80.02 as of Friday's close.
 (Click to enlarge)
The chart above shows that QE1 did have a significant effect pushing the value of the dollar lower starting about 4 months after the start of QE1. The dollar bottomed out a year later in November of 2009 and started to climb again even though QE1 was still in play. The dollar started down after that in anticipation of QE2 and at the conclusion of QE2 the dollar started to climb again. The dollar started down again in June of 2012 in anticipation of QE 3 but has climbed higher ever since the Fed announcement.
The chart above does not reflect the daily price action since the announcement of QE3 but the dollar bottomed out on September 14, the day after QE3 was announced and it has climbed 1.6% since then. The S&P 500 has fallen by 2.3% since September 14.
The Bernanke equity bubble
A stock analyst's worth is derived from his ability to identify and exploit distortions in a stock's real value and its market value. Analysts are constantly poring over data to identify a sleeper - a stock whose price is undervalued. Market "bubbles" are another type of distortion that occurs on occasion. In these instances markets price in huge premiums relative to real value and we end up with a "bubble."
A characteristic of "bubble" markets is the concept of "groupthink." Investors become less concerned about the underlying data as noted by Stephen Utkus of Vanguard Research in a piece he wrote on the nature of "bubbles" entitled "Market bubbles and investor psychology":
"Groupthink is a form of poor decision-making usually associated with fiascos. When under the influence of groupthink, a particular group begins to feel invulnerable; it rationalizes its behavior; and it systematically ignores external and contradictory sources of information. Groupthink is also characterized by a failure to examine alternatives, poor information search, and a failure to work out contingency plans. Late-stage asset price bubbles would seem to have many of these characteristics."
As an analyst I do the opposite of what those in a "groupthink" mindset do in that I do not "ignore external and contradictory sources of information." To the contrary - it is my job to do the exact opposite. I am supposed to search out data to try and identify disparities between real value and market value.
What prompted me to write this article was the obvious "groupthink" mindset that was evident as I listened to Fox Business on Thursday. I listen to Fox everyday during market hours and I noticed that Thursday's news was particularly negative. Prior to the markets open it was reported that 2nd quarter GDP had been revised downward from 1.7% to 1.3%. Additionally, durable goods orders fell by 13% in August.
I expected a significant and instant sell-off in the stock futures to the tune of at least 100 points in the Dow. It was a little disconcerting when the market did not move at all and eventually finished the day higher.
I finally got an answer to this odd response to the negative news when Fox interviewed a veteran floor trader at the NYSE. His explanation was that stocks can't go down - even with GDP falling and durable goods orders shrinking by 13% - since the Fed has promised to continue to print money indefinitely. We are going to be awash in excess cash and that cash has to go somewhere.
On Friday it was announced that Spain had completed a budget that called for tax hikes and spending cuts. The market initially moved a little higher on the news. Again, I was dumbfounded as these draconian moves - necessary as they are - are not bullish for stocks. Simple logic suggests that as money is extracted from an economy that economy must shrink in size. In other words, the country's GDP falls. That means that stocks in general should fall as well. Even though the market did get it right on Friday the initial rally in stocks after the announcement is typical of "groupthink."
Fox interviewed floor traders and stock analysts throughout the trading session on Friday. Every single interview of these so called "experts" produced the same consensus opinion:
- QE3 was bullish for stocks and commodities.
- Inflation resulting from the Fed's money printing guaranteed higher prices.
- The economic data coming out looked horrible but that did not matter.
What did Stephen Utkus say about "groupthink"?
"When under the influence of groupthink, a particular group begins to feel invulnerable; it rationalizes its behavior; and it systematically ignores external and contradictory sources of information."
I have written extensively on the subject of "Quantitative Easing" and the reason why it has failed to achieve the desired results. The evidence is conclusive and not really subject to debate - QE has not worked. Consequently, those who continue to expect much higher stock prices are doing so through a process of "rationalization" and "systematically (ignoring) external and contradictory sources of information."
It is important that you actually understand these "contradictory sources of information" and I strongly urge you to read the following articles:
- Why QE3 Can't Work - Understanding the Liquidity Trap
- Understanding Fractional Banking - Why QE Has Failed
My conclusions, supported by the Federal Reserve's own data, are that QE has had no impact at all on money supply, inflation and unemployment other than the psychological impact it has had on traders and investors. The tragedy in this is that ultimately Ben Bernanke and the Federal Reserve must take credit for the creation of a "bubble" in stock, bond and precious metals prices.
Until this week I was reasonably certain that we did not really have a "bubble" situation developing. It seemed to me that the markets were moving back to the upper end of the 12-year trading range pushed higher by short term traders playing the normal market swings. Two things changed my mind:
- The markets refusal to price in really negative financial data.
- The number of analysts who continue to argue that prices are moving much higher based on currency debasing moves on a global scale.
These two facts suggest that the market's recent move is, in fact, based on a legitimate "bubble" psychology that is more pervasive than I initially thought. When our so called "experts" are refusing to look at the evidence and just buying into the euphoria we can safely conclude that "groupthink" is in full play.
Another body of work that focuses on the psychology of markets is Nassim Nicholas Taleb's "black swan" events in his 2004 book Fooled By Randomness. Taleb's work draws the following conclusions:
- The event is a surprise (to the observer).
- The event has a major impact.
- After the first recorded instance of the event, it is rationalized by hindsight, as if it could have been expected; that is, the relevant data were available but unaccounted for in risk mitigation programs. The same is true for the personal perception by individuals.
"Black swan" events are an offshoot of "bubble" psychology and share the same characteristics as those noted except the "black swan" is that single event that provides the catalyst for the recalibration process. The housing crisis that precipitated the bank crisis is a "black swan" event. One day things were fine and the next day we were threatened with a systemic failure as stock prices plummeted.
As Taleb notes "the relevant data (was) available but unaccounted for in risk mitigation programs." Not being caught up in this insane euphoria, I can attest to the fact that the "relevant data" is available.
It is hard to know whether or not a "black swan" event will provide the catalyst for the market's eventual capitulation sell-off. It could develop as Stephen Utkus suggests:
"At some point, observed data becomes so overwhelming as to call into question the excessively optimistic forecasts of market participants. In the case of bubbles in stock prices, this occurs at the point where expected revenue and earnings growth rates fall somewhat short of optimistic expectations."
The capitulation sell-off may very well be the result of a disappointment in earnings as we enter the 4th quarter. I made note of a number of leading indicators that were signaling a top in the markets in a recent
article.
Another article that weighs in on the subject is my take on the nature of the sell-off as we move toward that
fateful day when the capitulation sell off occurs. The shift in sentiment in a "bubble" market crash is rapid and the sell-off is a vicious thing. The 2011 crash gives the reader an idea of how far a market can fall and in a very short period of time.
Is current market pricing fairly characterized as a bubble?
A surge in stock prices is not necessarily a "bubble." Markets do move but they typically don't exceed the long term mean by more than 2 standard deviations. A bubble is properly characterized by the extent of its deviation from the mean coupled with the characteristics reflected above - that is a tendency to ignore negative data.
In the case of the current market, both conditions are present. I recently wrote on the subject of long term expectations in stock prices. My assertion was that we have been range bound since 2000 with the upper end of the range in the 1500 level and the lower end of the range around 800 basis the S&P 500.
"The Era of Buy and Hold is Over - Using Trade Structure to Play the Swings" sets forth what I consider to be the outer end of the trading range.
 (Click to enlarge)
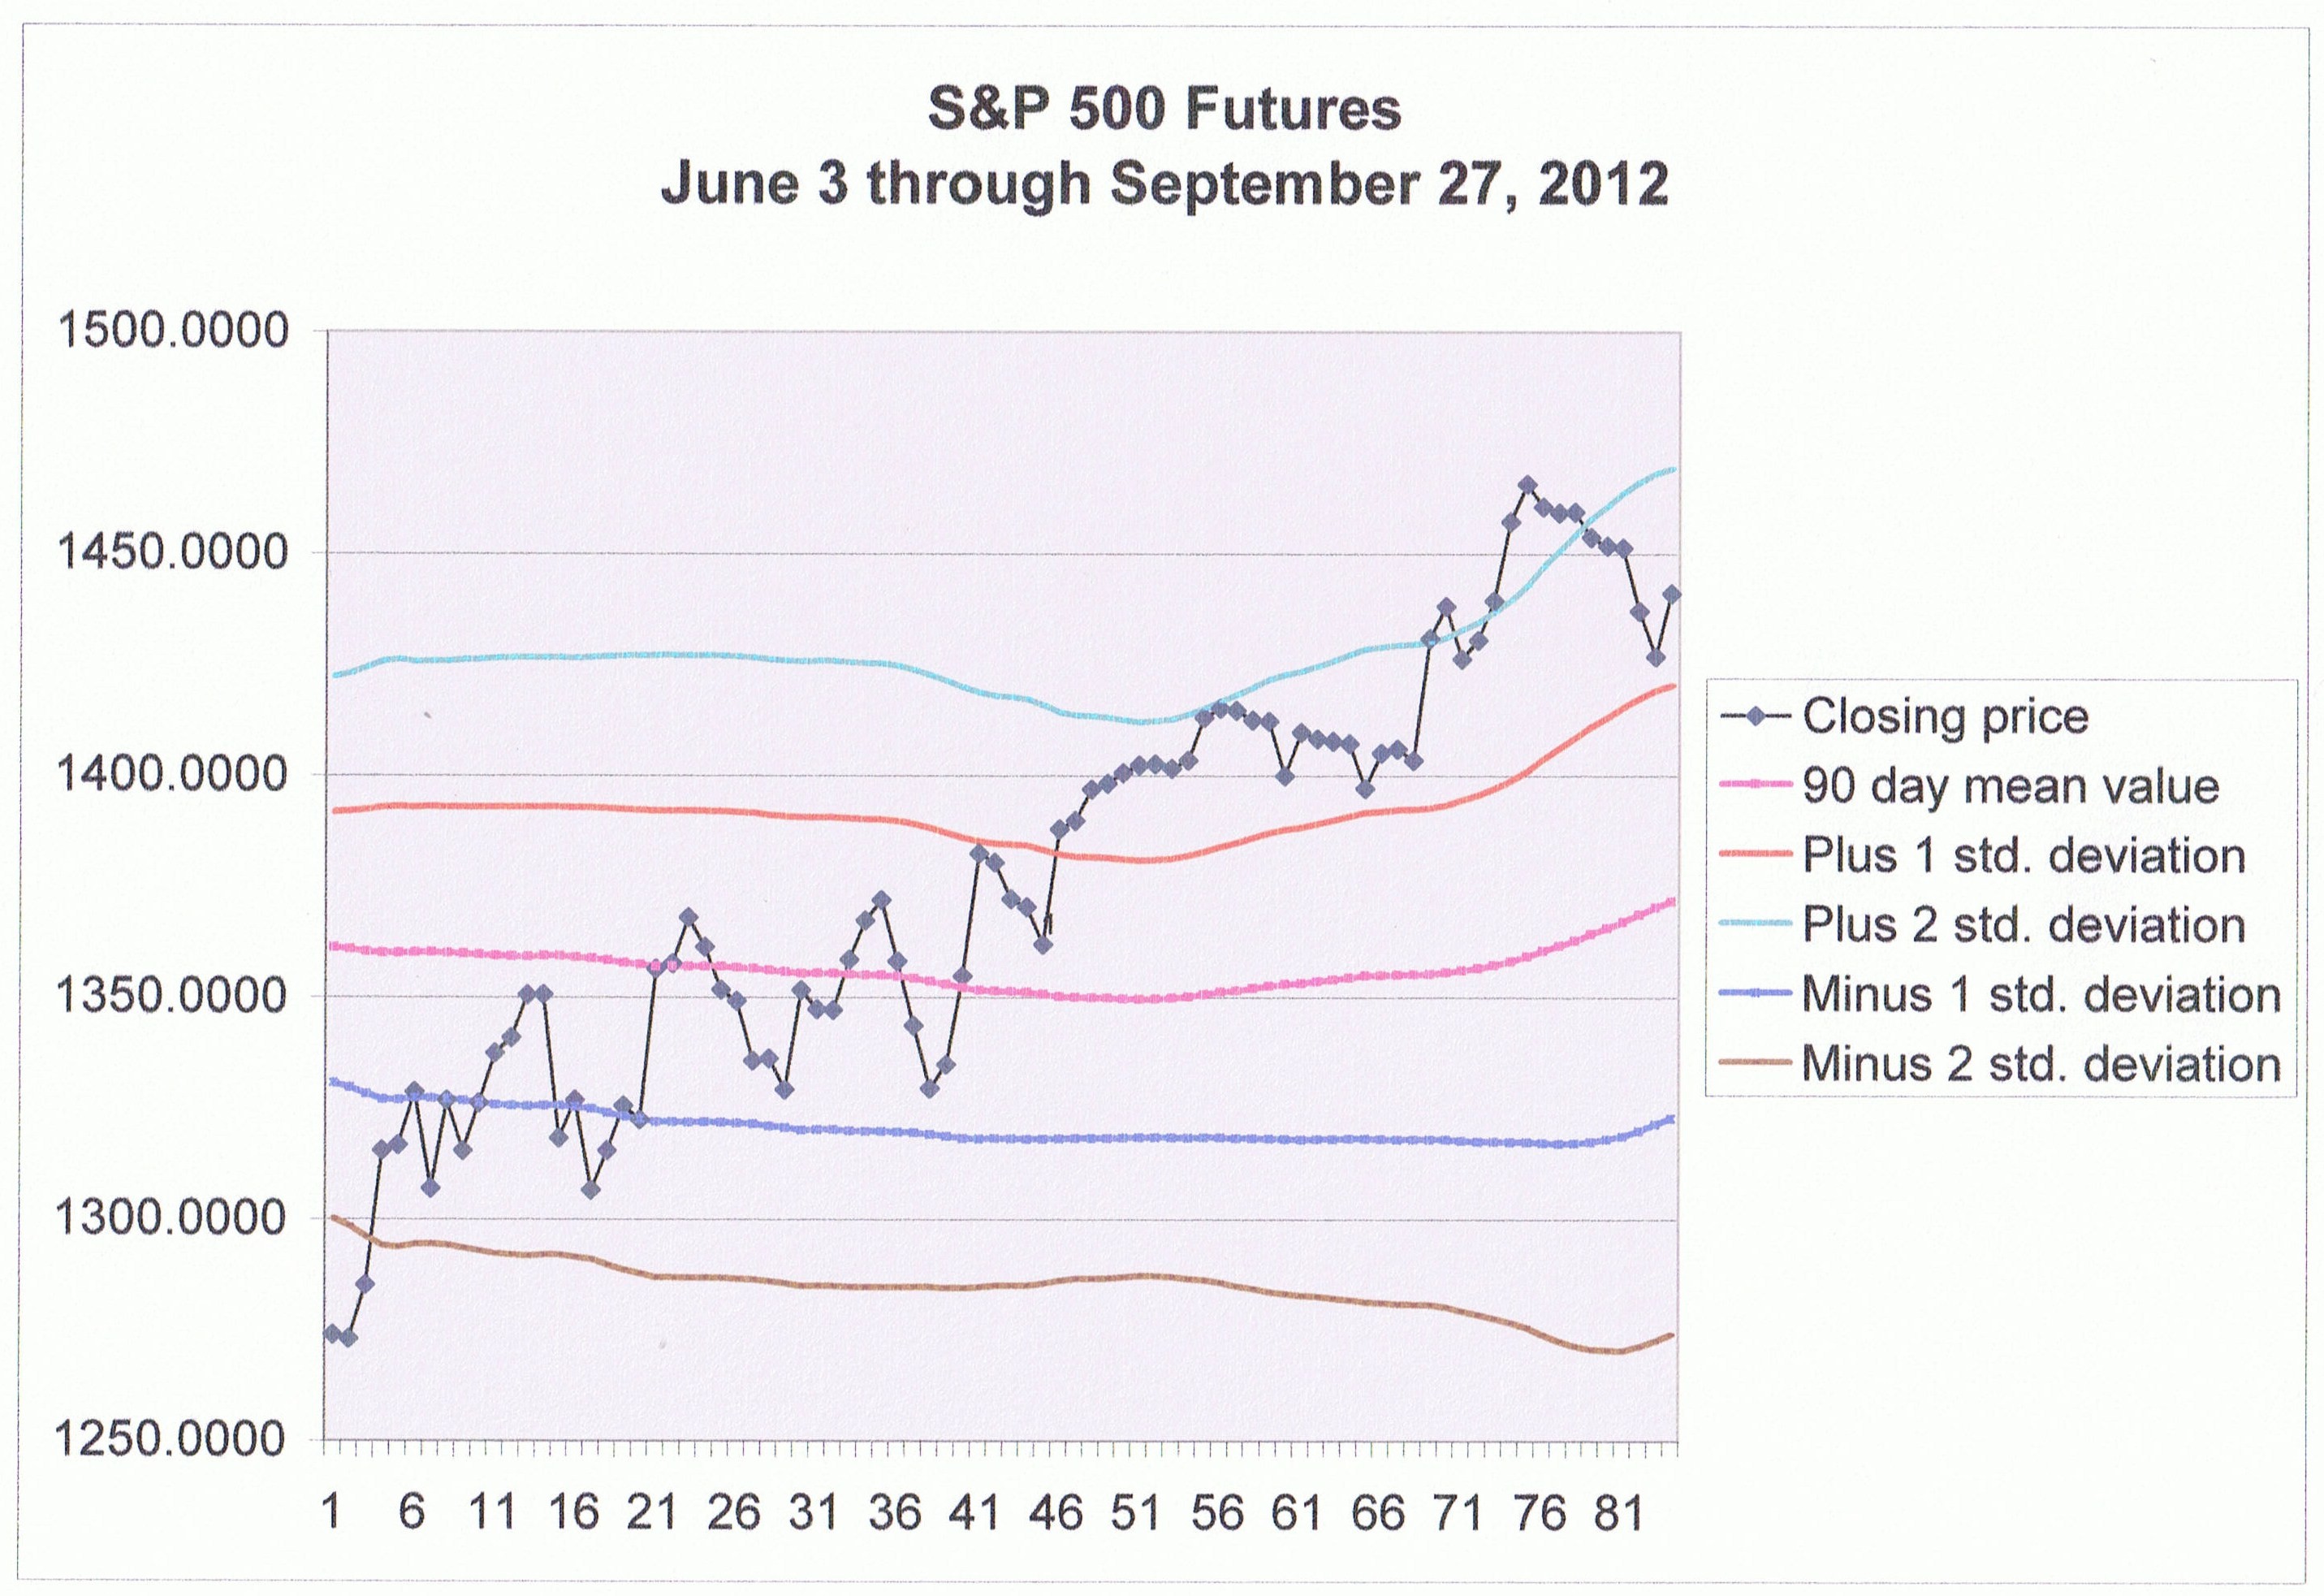
The chart above uses statistical calculations to create a framework. The center line is the 90-day moving average or mean value. The lines that parallel the mean represent the calculated values for 1 standard deviation and 2 standard deviations above and below the mean.
Statistics tell us that 65% of the time the 1 standard deviation bands up and down form the mean that will contain the next data point, which in this case is the closing value represented by the jagged line. At 2 standard deviations the close will be contained within those outer boundaries 95% of the time. The chart above shows that this is true. I have run huge volumes of data and it is always true. The outer bands - given a large enough population of data points - will indeed contain the next data point to the 95th percentile
The days leading up to the Fed's announcement of QE3 reflected 6 closing values in excess of the 2 standard deviation level before moving lower back into the 95th percentile range. One must conclude - even without considering the negative economic backdrop - that the market has extended itself well beyond rational price levels. Couple that with the fact that we do indeed have significant headwinds facing us as we move into the 4th quarter and on into 2013 and the only conclusion to be reached is that we do indeed have a "bubble" in equities.
Taking a rational look at the market and the economy
I started this article by setting forth the following assumptions which provide the rationale for higher stock prices:
- Monetary policy is rapidly depreciating the value of currencies world wide guaranteeing a rise in assets including stocks and commodities.
- Even with the global backdrop of high debt, deficit spending and high unemployment U.S. stocks must go up as they represent the best of the worst.
- Money will naturally flow into U.S. stocks because there is no other logical place for money to go with bond yields artificially depressed by monetary policy.
Monetary and fiscal policy
Monetary policy is not depreciating the value of the U.S. dollar. To summarily conclude that the Fed's QE policies are expanding money supply and devaluing the dollar without even looking at a simple chart of the dollar (U.S. dollar index futures) is just the sort of thing that exemplifies "bubble" psychology.
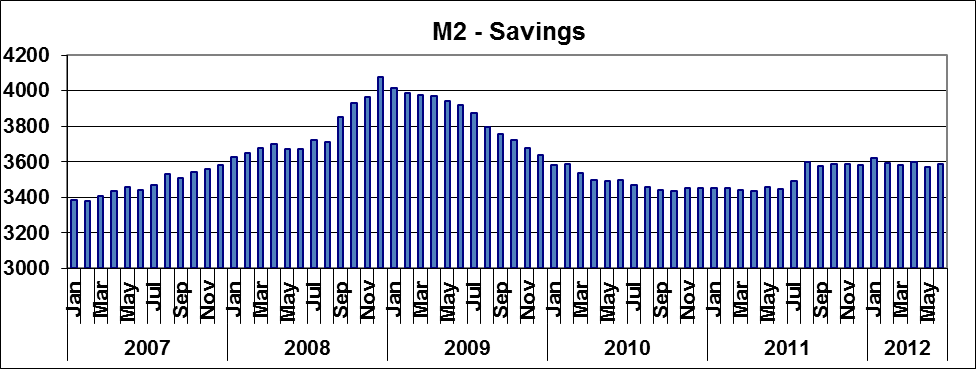
The Fed's policies have not yielded the desired or intended results. We are stuck in a "liquidity trap" where money is being hoarded, not spent. The result is that M2 money supply is not growing any faster than normal despite abnormal and very aggressive efforts to accomplish the exact opposite. More important is the fact that the savings component of M2 is growing at a much faster rate than normal, leaving spendable cash available to grow GDP virtually flat since the Fed started their QE program.
 (Click to enlarge)
We are stuck in a "liquidity trap" and that is a fact. Money is being hoarded, not spent and that applies to individuals as well as corporations. Debt is being paid down and excess cash is being saved - even at historically low interest rates - out of fear. Cash balances on corporate balance sheets have swelled since 2009 and individuals to the extent they are able, have also accumulated cash. The only big spenders left on the planet are the governments themselves.
 (Click to enlarge)
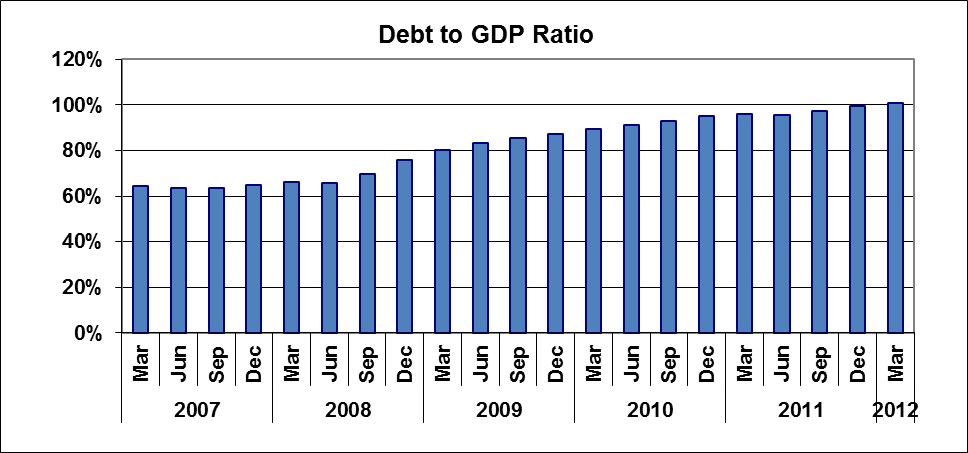
The government has attempted to pick up the slack by borrowing and spending at an unprecedented rate pushing our debt to GDP ratio above 100%. The logic in this free spending strategy is that it would stimulate growth and increased GDP would boost tax receipts and mitigate the consequence of the massive debts. The chart below suggests otherwise.
Federal Receipts vs. Expenditures Reflected by Quarter
 (Click to enlarge)
The two charts above set up the "fiscal cliff" issue. If you listen to President Obama or the various analysts and traders weighing in on the "fiscal cliff" issue you will reach the conclusion that it is no big deal. It is just a game of brinkmanship by the Republicans and the Democrats and they will not let us fall off the "fiscal cliff" in the end.
I literally cringe when I hear someone say that. What exactly do they think the solution is I wonder? The Congressional Budget Office weighed in on the matter with two separate scenarios:
- Extend the tax cuts and forego the spending cuts and we might avoid a recession for one more year but that path is unsustainable and we will be relegated to the status of Greece with borrowing costs climbing in spite of the Fed's efforts to cap them.
- Go ahead with the tax increases and spending cuts - in other words go off the "fiscal cliff." The CBO tells us that this pretty much guarantees a recession in 2013 but the better of the two scenarios is still to simply go over the cliff.
"Groupthink" is in full play on this one. Simply tune into Fox or Bloomberg and listen. You will hear one supposedly qualified analyst after the other make the assertion that the Fed's policy has consistently devalued the dollar and the result is much higher stock and commodity prices in the coming months. They just dismiss the various headwinds we are facing. Here is a short list:
- Decades of overspending and excessive use of leverage by government, businesses and the citizens have created an unsolvable problem without a completion of the deleveraging process and a final bottoming out.
- Failed fiscal policy that sets up the "fiscal cliff" issues virtually guarantee a recession in 2013.
- A failed monetary policy where all countries are playing a game of musical chairs with currency devaluation that do nothing but cancel each other out.
- Depression era unemployment levels that will take the unemployed out of the consumer pool in 2013 as spending cuts go into effect
- A massive debt burden and deficit spending problem that must be dealt with in 2013.
- A liquidity trap spawned by fear that is driving people to save rather than spend.
- A recession in Europe that is being dealt with by bailout and austerity measures which is the right approach but will result in deepening the recession.
- China's economic contraction resulting from the economic contraction of its trade partners.
- Record low interest rates stifling any chance of increased bank lending - the reason being that the risks are not commensurate with the reward.
- Substantially reduced earnings for those who rely on reasonable interest rates to supplement their income leaving them with less money to spend.
Well, maybe it's not such a short list after all. It's hard to imagine stock prices moving higher even if the Fed's "money printing" was actually creating inflation. The following chart is additional support for the fact that it is not doing that though:
 (Click to enlarge)
U.S. stocks must go up because they are the best of the worst
As absurd as this statement sounds to a rational person, it is repeated frequently by those who have been caught up in the "groupthink" mindset. The logic apparently goes like this - you won't lose as much value in U.S. equities as you will in other investments because as bad as things are, investors will prop up the U.S. stock market since it is not quite as bad. In other words, you won't lose quite as much money in U.S. stocks as you might in eurozone stocks and therefore U.S. equities are a good buy.
Money will naturally flow into U.S. stocks as there is no other place to invest
The logic behind this thinking is based on the premise that the Fed's monetary policy virtually assures an explosion in money supply and serious inflation. If that premise is correct then the strategy makes sense.
Inflation will solve a lot of ills. First, it will drive banks to lend and consumers to spend. In other words it will do exactly what Keynes said it would do - expand the economy and put us back on a growth path.
Keynes also recognized the impact of "liquidity traps." In a "liquidity trap" there is ample liquidity within the banking system to provide for an expansion of money supply through a net increase in loans but no one is interested in tapping into this liquidity. Today banks are reluctant to loan and borrower's are reluctant to borrow and the result is that all that excess liquidity remains trapped.
If stocks are a bad investment then where do you put your money?
We are still in a safe zone on stock prices and there is still time to take profits. I advise you do that and go to cash. The idea that you must be invested to beat inflation assumes that inflation is imminent. It is not and all the data points to the opposite - deflation. Again, please take a look at some of the work I have done on this subject. It is an eye opener.
Cash is actually an investment asset despite opinions to the contrary. Its value moves inversely and in direct proportion to the asset you are currently holding or considering buying. In other words if you go to cash and the stock you sold goes down in value by 50% the value of your cash relative to that stock goes up by 100%. Those who would tell you that you have to be invested in something to protect against the impact of inflation assume inflation is a foregone conclusion - a severe case of "groupthink."
We can see that despite all the fiscal stimulus and monetary policy easing initiatives inflation has been a particularly stubborn problem for the Fed. Keep in mind that inflation is what they are trying to create with QE. What is actually occurring is disinflation - a decrease in the rate of inflation.
We are very close to falling off the cliff on inflation as well. The inflation chart above shows that we did turn negative in the 2nd quarter of 2009. The rate of inflation went from about 6% positive to 2% negative in about 12 months. A repeat of that scenario - an 8% drop - from current levels would put us at minus 7%.
If you don't fully grasp the significance of this let me spell it out for you. A 7% negative inflation rate means that GDP would probably contract by 7%. Add to that the spending cuts and tax hikes and that pulls another 3% out of the economy. The result is a 10% drop in GDP. That of course will drive employers to take cover with more spending cuts - in other words layoffs. We are already at depression level unemployment levels so where do we go from here?
The chance of avoiding a recession in 2013 is pretty slim. The Congressional Budget Office Report to Congress gave two scenarios - go over the fiscal cliff and enter recession in 2013 or continue on the current path toward $1 trillion a year in deficit spending and find ourselves in the same boat as Greece in a few years.
No politician is going to admit that no solution exists that is palatable but that does not change the facts. We are still headed for recession in 2013. The Fed's last move with QE3 was sheer desperation. The ECB is confronted with the same situation. With all the major economies contracting recession is simply unavoidable.
If you accept these forecasts you must dismiss the idea that you have to be invested in stocks, bonds, metals or real estate. All these asset classes will fall in value in a recession - particularly a protracted one. The only asset that will appreciate in value in this situation is cash.
Consider once again that cash moves inversely and in direct proportion to the asset you own. If you own a stock and decide to sell it and it falls in value by 50% the cash you have will allow you to buy twice as much of that stock at the lower price. That is a 100% gain in value by simply setting on cash and waiting.
If cash is the best asset choice then one can enhance the return with leverage. There are a number of ways to accomplish this. One way is to simply sell stocks and re-employ the cash by going long the Dollar Index futures contract. You could also buy Dollar Index calls.
A third option is to buy the Dollar Index ETFs. Powershares U.S. Dollar Bull Fund (
UUP) is a good choice. You can even leverage a little further with Powershares 3X Long U.S. Dollar Bull Fund (
UUPT). Of course call options on these ETFs are also an alternative.
Going to cash does not have to be a passive investment where you just set back and wait. Any of the above choices will actually grow your cash in a recession and the growth can be dramatic if a deflationary spiral is the ultimate outcome as I suspect it will be.
I know there are investors who find it difficult to abandon their long term buy and hold philosophy. To those investors I would suggest at the very least you take a protective stance by writing covered calls against your stock holdings or buy puts to protect against the downside.
Conclusion
I am sure there are those who will see this article as nothing more than the words of another pessimistic "permabear" predicting doomsday. I assure you that is not the case.
I was long the market from the 4th quarter of 2011 and was very optimistic about the prospects of a great year in 2012. Surprisingly, my full year's target for stock prices was reached in the 2nd quarter and I reacted by taking profits, assuming that a pull back was in order.
The rate of climb from the 4th quarter of 2011 to the 2nd quarter of 2012 was simply too much and too fast. I took profits expecting a modest correction and a resumption of the bull move going into the end of the year. In other words I have been - to my own surprise - incredibly precise in my timing this year.
What has caused me to shift my thinking in the last few weeks is based mostly on my own research. I wanted to crunch the numbers to see how effective the Fed's monetary policy really was. To my surprise I found that we were indeed stuck in a "liquidity trap" and that the Fed's QE policy was a dismal failure.
I spent the summer gathering data and crunching the numbers and I found that inflation was proving to be a stubborn and persistent problem for the Fed. I also looked into the
unemployment problems and drew my own conclusions in this area as well.
I am a Keynesian by training and refuse to dismiss Keynesian theory as an outdated theory of macro economics. Keynes did identify "liquidity traps" in his body of work and explained it quite well. Keynes recognized that economics is a social science in the sense that we, as economists, attempt to predict public response in certain situations and implement policy in a way that will cause the public's response to shift in the direction we desire.
The fact that monetary policy has failed to induce the desired response from the public suggests a problem that is not rooted in monetary policy at all. It is rooted in a dysfunctional government that has perpetuated a policy of irresponsibility by unleashing the greed of the people and allowing - no encouraging - irresponsible behavior on the part of its citizens, corporations and banks.
The "black swan" event that took place in 2008-09 with the systemic collapse of the banking system in the United States was a turning point. The fear that we felt in those days as Hank Paulsen, Ben Bernanke, President Bush and Congress grappled with solutions to the problem are not forgotten. "We the people" get it and it scared us. We are still scared and with justification.
Perhaps we are too afraid at this point as we have, in all likelihood over-reacted. Today our banking system is relatively sound. Our corporate coffers are full of cash and private citizens have moved to deleverage by paying off debt and saving money. The problem, as Keynes correctly pointed out, is that these efforts to shift into reverse and embrace prudence are the very thing that we don't want to do if we expect to recover and move back to a period of full employment and growth.
It is a catch-22 situation. As a group, we need to begin to borrow and spend to grow the economy and the Fed's monetary policy has been designed to get us to do that. The problem is that if we don't all do that collectively, we will not get the economy moving in the right direction.
It is hard, as an individual, to go back to a policy of free and easy when the masses are moving in the other direction. If we do that and the masses don't follow, we end up getting burned and so we choose to continue with a prudent approach and the result is that we end up being our own worst enemy from a macro perspective even though we are doing the right thing from our own individual perspective.
I can only hope that those who read this will see my point and take precautions. I am as certain as I have ever been in over 40 years as an analyst that this phase of deleveraging and economic contraction is not over. We have a lot of work to do and it is not going to be easy or pleasant. It will take a long time to forget what brought us to the edge of the cliff in 2008 -09 and I'm afraid we have not yet paid the full price for the fiscal irresponsibility that we have embraced as a nation over the last several decades.


 Terrence Horan/MarketWatch